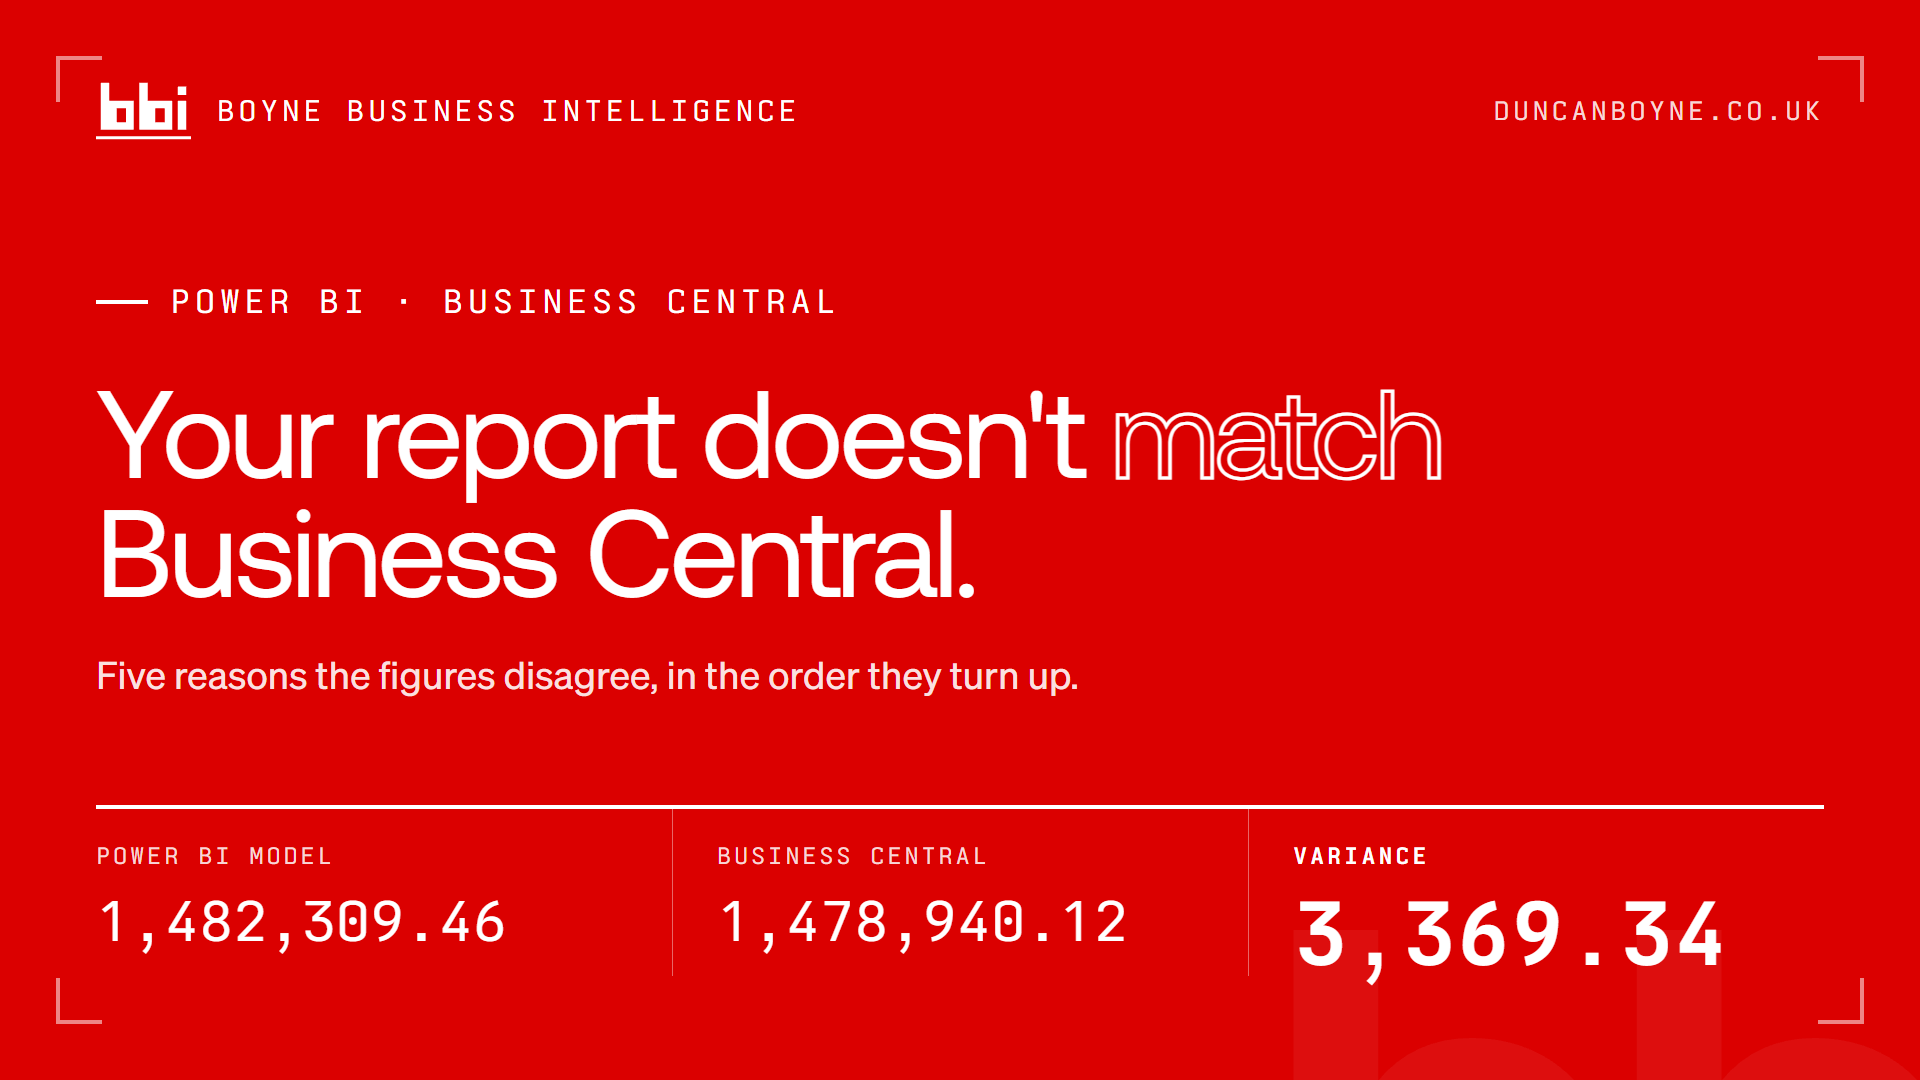
Nothing empties a boardroom of goodwill faster than a number on a screen that the finance director does not recognise.
You have built the report. It refreshes, it looks good, the chart is the right way up. Then somebody says "that's not what BC says" and the whole thing is over. Not just that figure. The report. Possibly the project. Because once a room decides the numbers are wrong, every other number on the page is guilty by association, including the ones that were fine.
The frustrating part is that the report is usually not wrong. It is answering a slightly different question to the one Business Central answered, and nobody wrote down which question either of them was asked.
The short version: a Power BI figure disagrees with Dynamics 365 Business Central for five common reasons. You are reporting on document date where BC reports on posting date, you have not flipped the sign on income accounts, you are reading the wrong table so unposted orders are counting as sales, you are summing Amount instead of Amount (LCY), or the scope differs, meaning a different company, a dimension filter, or reversed entries counted twice. Test them in that order, because that is roughly how often they turn up.
Here is each one, and how to prove it in a couple of minutes rather than argue about it for a week.
1. Posting date is not document date
This is the big one, and it catches nearly everybody once.
Business Central carries both. The document date is when the paperwork says the thing happened. The posting date is when it hit the books, and it is the posting date that every standard BC financial report and every accounting period is built on. They agree most of the time, which is exactly what makes this dangerous, because they disagree at month end, on invoices posted late, on anything backdated, and on whatever went in after somebody closed the period.
Power BI, meanwhile, will happily join document date to your date table and give you a beautiful March figure that no month end pack will ever match.
To test it, run the same total twice, once grouped by posting date and once by document date. If the difference lands in the boundary months, that is your answer. Posting date is almost always the one you want, because it is the one the accounts were signed on. If the report offers both, label them so obviously that nobody can pick the wrong one by accident.
2. Signs: income is a credit, so revenue arrives negative
General ledger entries hold debits as positive and credits as negative. A sale credits an income account, so your revenue comes out of the ledger as a negative number. BC's own income statement flips it for presentation, which is why nobody notices until they build something themselves.
So your revenue measure is negative, or somebody spots that and wraps it in an ABS, and now credit notes are making revenue go up.
Flip the sign once, deliberately, in the model, with a comment next to it explaining why. Never flip it in the visual, and never flip it in six different measures, because the seventh will get missed and you will spend an afternoon finding out which one.
3. The wrong table: orders are not sales
This is the one that produces the most confident wrong numbers, because the field names all look right.
Business Central keeps unposted documents and posted documents in different places. The sales order or draft invoice somebody is still working on lives in one set of tables. The invoice that has actually been posted lives in another, and only the posted one exists in the general ledger. Pull sales from the unposted side and your revenue includes orders that have not shipped, quotes nobody ever converted, and a line an ops manager is halfway through editing right now.
The tell is a report that is consistently higher than finance's figure and moves during the day.
Decide which question you are answering and pull from the matching place. Pipeline and open orders make a genuinely useful report, and so does posted revenue. They are two reports. An unlabelled mixture of both is not a report, it is a coin toss. Where the figure has to tie back to the accounts, go to the general ledger entries and nowhere else.
4. Currency: Amount is not Amount (LCY)
If you trade in more than one currency, BC stores both the transaction amount and the local currency amount, and they sit next to each other with almost the same name. Sum the wrong one and you get a total that is technically the sum of real numbers and completely meaningless, because you have added euros to pounds.
The tell is a report that is nearly right, out by a percent or two, and out by more in months with more overseas activity. Report in local currency by default, always, and if somebody genuinely needs the transaction amount, give it its own clearly named measure.
5. Scope: company, dimensions, and entries counted twice
Then the boring ones, which are somehow still about a third of all cases.
An environment can hold several companies, and it is very easy to build a report that quietly covers two of three, or one that silently unions all of them when finance was only ever looking at the trading entity. Check the company list before you check anything clever.
Dimensions are next. If the pack finance compares against is filtered to a department or a cost centre and your model is not, you are comparing a slice to a whole. The way dimensions hang off entries in BC is indirect enough that this is easy to get wrong with no visible sign that you have.
Then reversals. A reversed or corrected entry leaves both the original and its reversal in the ledger, which is correct, auditable, and also means a naive sum double counts unless you have handled the reversal flag. Same story with anything posted twice and backed out.
Lastly, and I say this with love, check whether somebody left a filter on a visual, took a screenshot of it, and whether that screenshot is now the number the whole argument is about.
The check that ends the argument permanently
All of the above is diagnosis. The cure is a reconciliation you run every time, not a conversation you have every time.
Build a trial balance in Power BI, from your own model, and compare it to the trial balance out of Business Central for the same period. Then put the variance on the page as a number. Not a chart. A number, ideally in the corner of the report, that reads zero.
If it reads zero, the model agrees with the ledger and you can defend anything built on top of it. If it does not read zero, you have found the problem before the board did, which is the entire point. Anything that ships with a variance is a draft, whatever the deadline says.
That single figure changes the conversation more than any amount of design work. People stop asking whether they can trust the report and start asking it questions, which is the behaviour you actually wanted.
And the honest caveat
Some differences are real. Occasionally the report is right and the spreadsheet everybody has been using for four years is wrong, and that is a much more awkward meeting than the one where you fix a sign convention. Go and check the source before you tell anyone that, though. Be very sure. I have been the person who was very sure and then wrong, and it is not a pleasant afternoon.
Anyway. If your Power BI and your Business Central disagree and nobody has been able to say exactly why, that is a fixable problem and usually a quick one. A Power BI Health Check covers the model and the measures underneath it, scored, with the issues ranked, and there is a live financial report built on anonymised ERP data in the portfolio if you would rather click around one than read about it. Or just drop me a message and tell me which number is arguing with which.